Charts
Charts is a feature-rich, interactive charting library with a vast number of chart types, from basic plotting to complex financial charting.
Interaction with the vector graphics is animated. They render crisp on any device.
|
Note
|
Commercial feature
A commercial Vaadin subscription is required to use Charts in your project. |
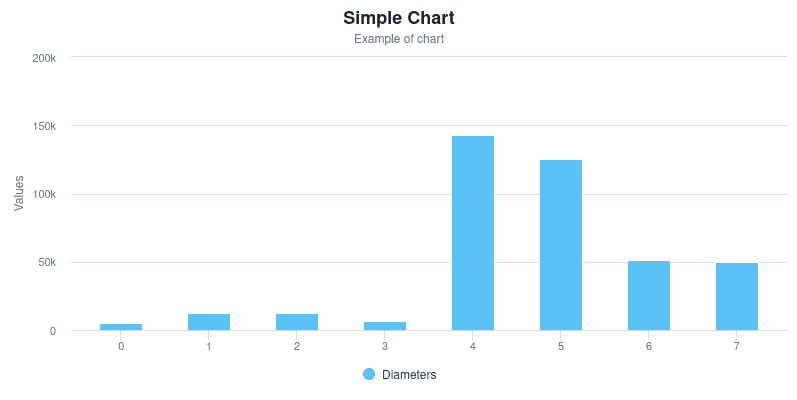
<Chart title="Simple Chart" subtitle="Example of chart">
  <ChartSeries
    type="column"
    values={[4900, 12100, 12800, 6800, 143000, 125000, 51100, 49500]}
    title="Diameters"
  />
</Chart>
Have a look at the Elements API for live examples and details.
Chart Types
Charts come with over a dozen types of charts. They’re listed alphabetically in the table here:
|
|
|
|
|
|
|
|
|
|
|
|
|
|
|
|
|
|
|
|
|
|
|
|
|
|
|
|
|
Examples
The sections that follow provide examples of charts.
Column Chart
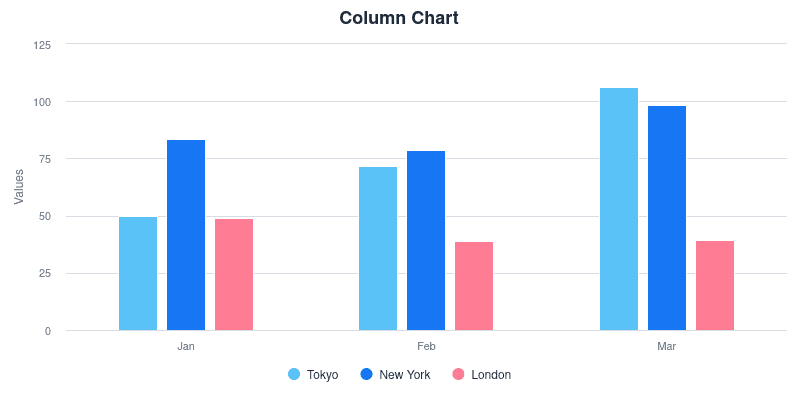
<Chart
  title="Column Chart"
  type="column"
  categories={["Jan", "Feb", "Mar"]}
>
  <ChartSeries title="Tokyo" values={[49.9, 71.5, 106.4]} />
  <ChartSeries title="New York" values={[83.6, 78.8, 98.5]} />
  <ChartSeries title="London" values={[48.9, 38.8, 39.3]} />
</Chart>
Area Chart
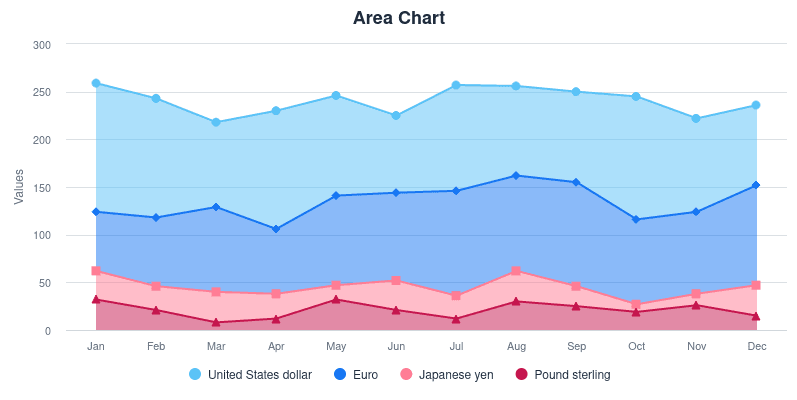
<Chart
  type="area"
  title="Area Chart"
  stacking="normal"
  categories={"Jan,Feb,Mar,Apr,May,Jun,Jul,Aug,Sep,Oct,Nov,Dec".split(",")}
>
  <ChartSeries
    title="United States dollar"
    values={[135, 125, 89, 124, 105, 81, 111, 94, 95, 129, 98, 84]}
  />
  <ChartSeries
    title="Euro"
    values={[62, 72, 89, 68, 94, 92, 110, 100, 109, 89, 86, 105]}
  />
  <ChartSeries
    title="Japanese yen"
    values={[30, 25, 32, 26, 15, 31, 24, 32, 21, 8, 12, 32]}
  />
  <ChartSeries
    title="Pound sterling"
    values={[32, 21, 8, 12, 32, 21, 12, 30, 25, 19, 26, 15]}
  />
</Chart>
Pie Chart
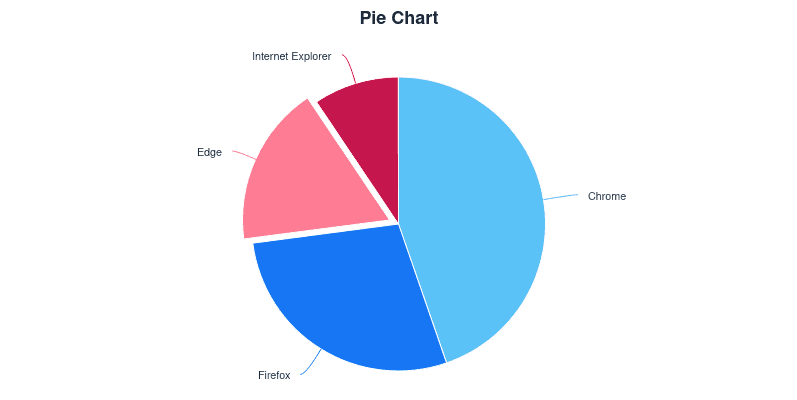
<Chart type="pie" title="Pie Chart" tooltip>
  <ChartSeries
    title="Brands"
    values={[
      { name: "Chrome", y: 38 },
      { name: "Firefox", y: 24 },
      { name: "Edge", y: 15, sliced: true, selected: true },
      { name: "Internet Explorer", y: 8 },
    ]}
  />
</Chart>
Polar Chart
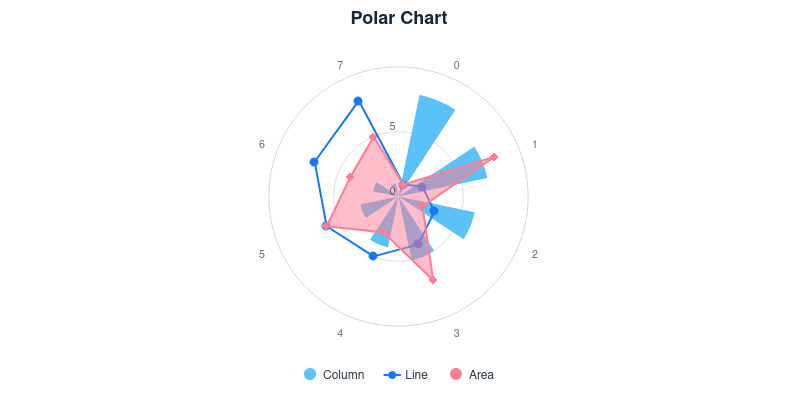
<Chart polar title="Polar Chart">
  <ChartSeries
    type="column"
    title="Column"
    values={[8, 7, 6, 5, 4, 3, 2, 1]}
  />
  <ChartSeries type="line" title="Line" values={[1, 2, 3, 4, 5, 6, 7, 8]} />
  <ChartSeries type="area" title="Area" values={[1, 8, 2, 7, 3, 6, 4, 5]} />
</Chart>|
Important
| You can find more information in the corresponding article on vaadin.com. |